Building the k1nd4-cluster: k3s, GitOps, and a Monitoring Stack That Just Works
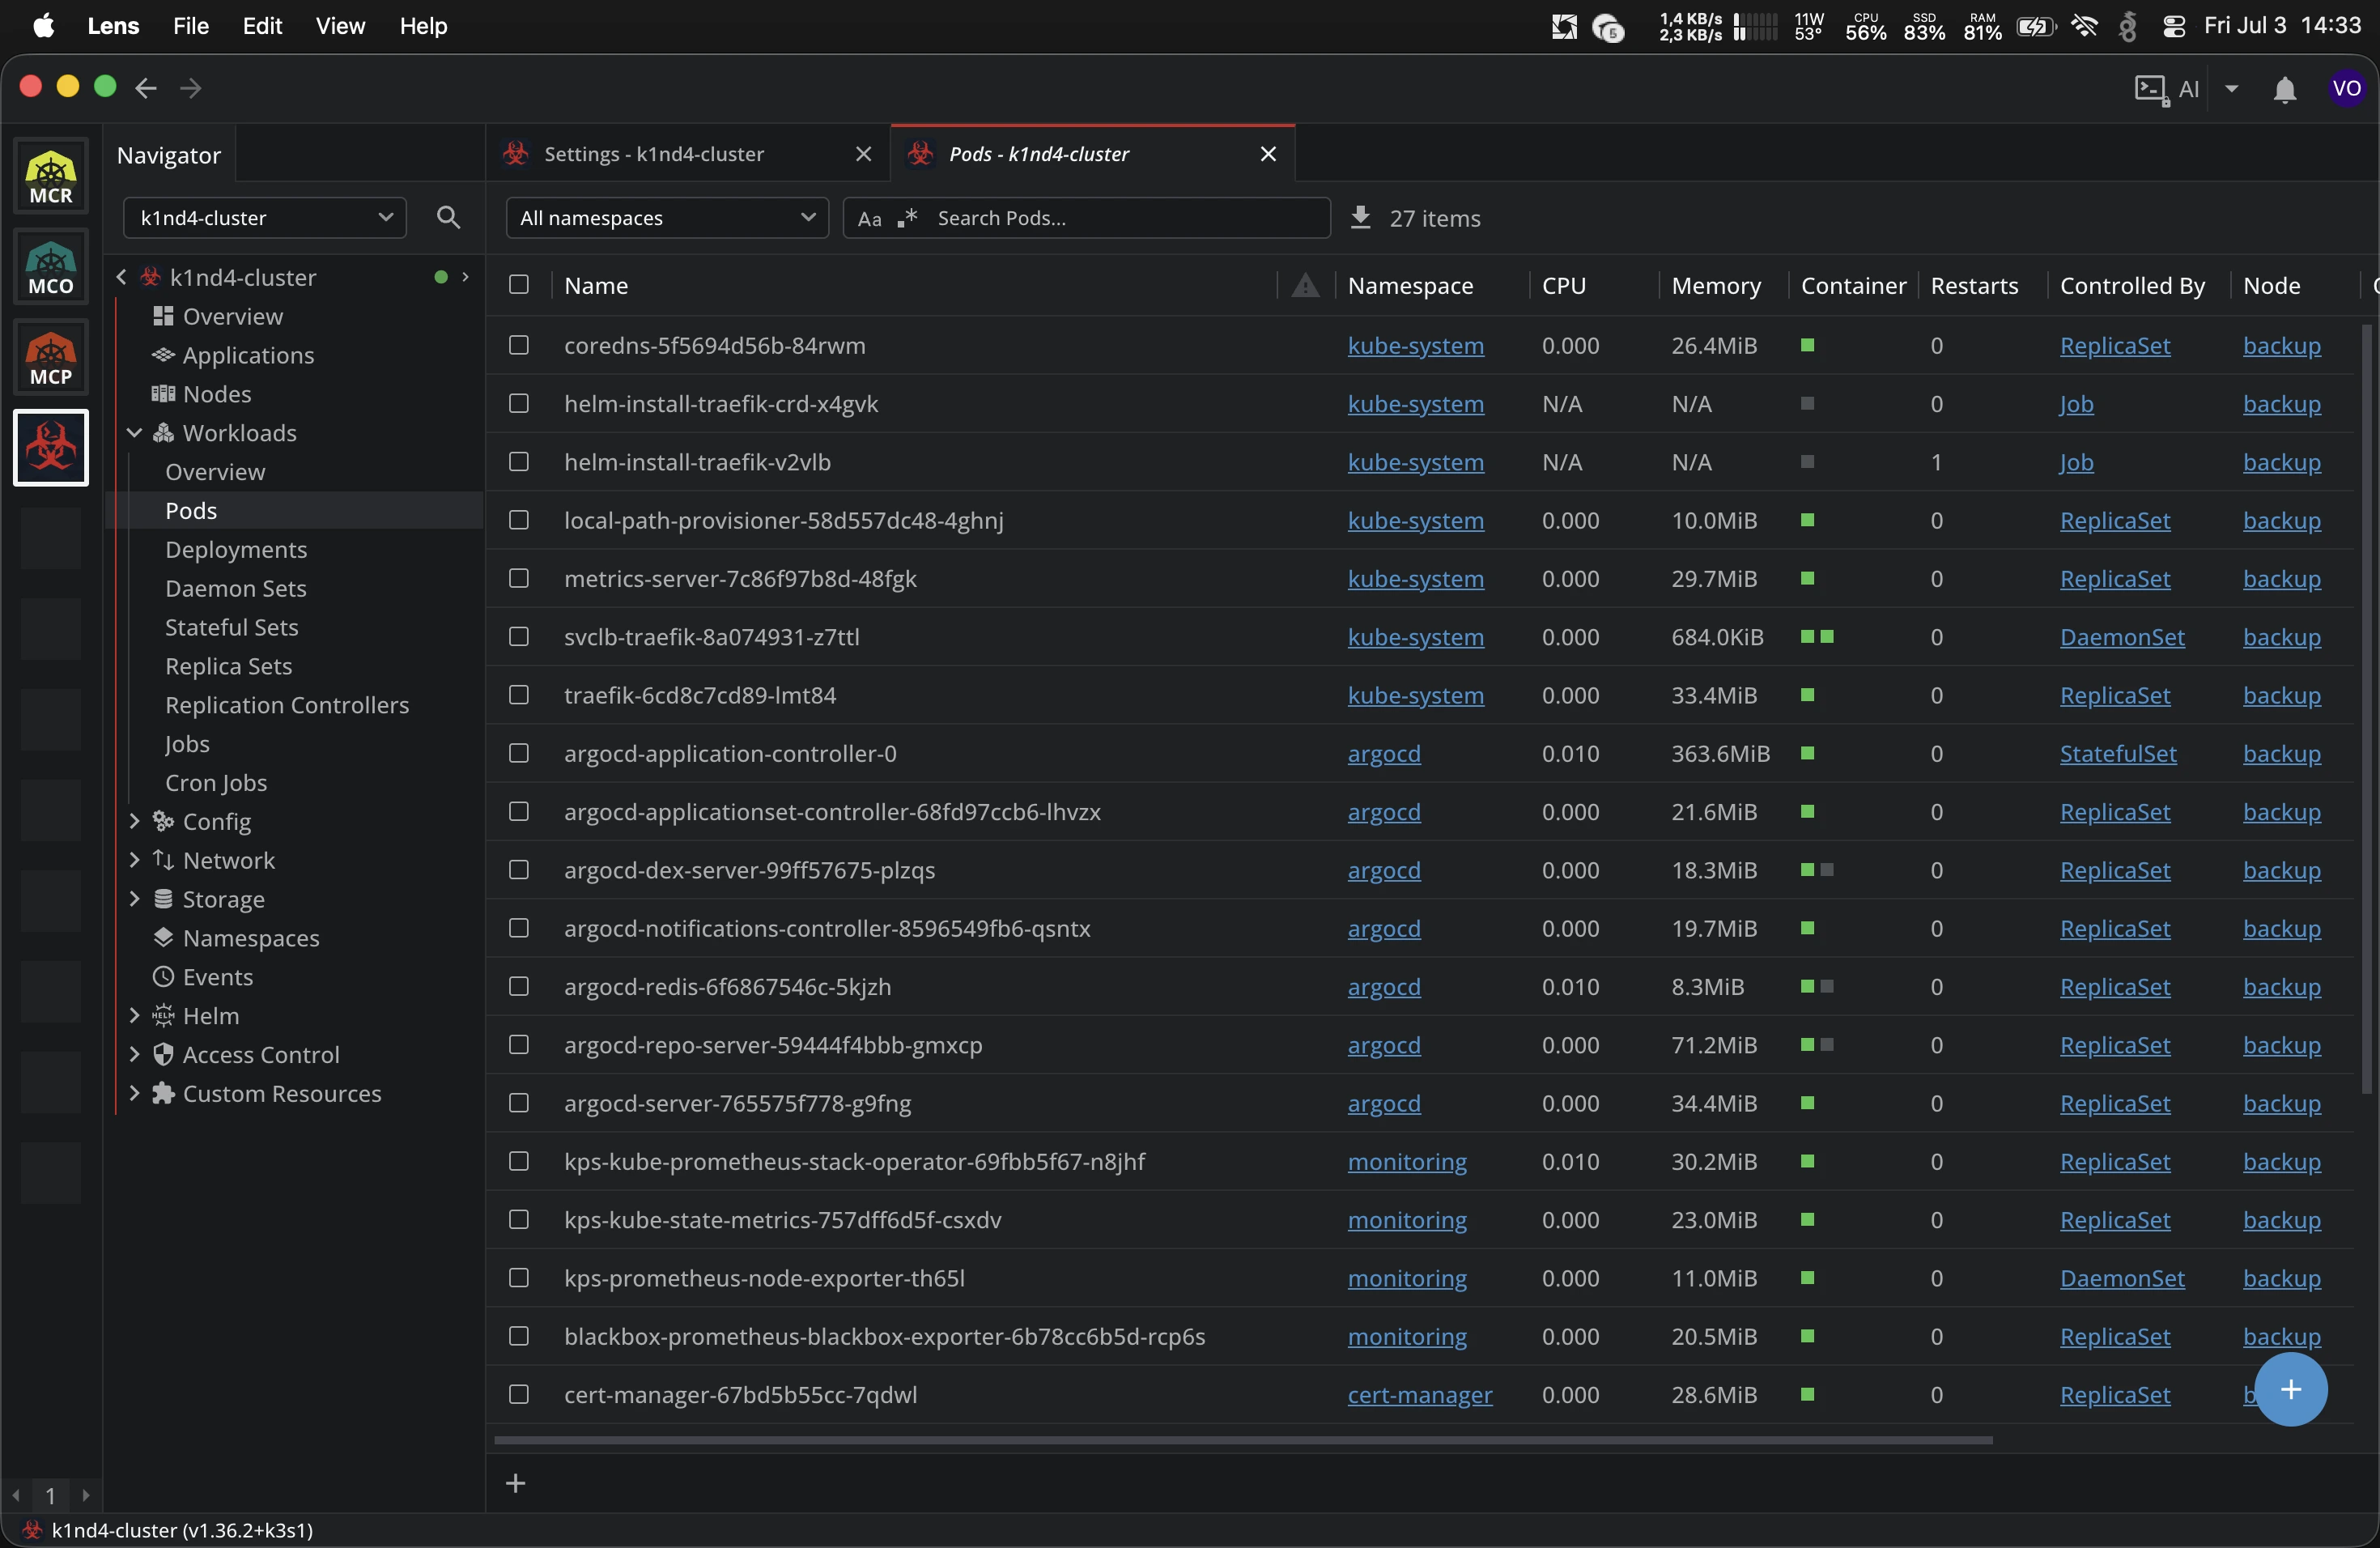
The goal
We wanted a single machine to host the K!nd4sus websites and services with the workflows you’d expect from a “real” platform:
- Declarative everything: no
kubectl applyfrom my laptop at 2 AM - GitOps: the cluster state lives in Git; pushing is deploying
- Automatic TLS: certificates that issue and renew themselves
- Observability: node metrics, cluster health, and uptime probes for every hosted webpage
- Alerting: if a site goes down or a cert is about to expire, I get an email. If everything is quiet, I can trust the quiet.
The hardware and base layer
One node: 32 cores, 32 GB RAM. Plenty for a lab that hosts websites, CI-driven deployments, and a monitoring stack with room to spare.
For Kubernetes I picked k3s, a single-binary, CNCF-certified distribution that’s ideal for one node:
- Ships with Traefik as the ingress controller
- Ships with the local-path storage provisioner (PVCs become directories on the node’s disk)
- Control plane components (scheduler, controller-manager) run embedded in the k3s binary: this detail matters later
curl -sfL https://get.k3s.io | sh -Certificates: cert-manager + Let’s Encrypt
Every public endpoint gets TLS via cert-manager, which automates the entire ACME flow against Let’s Encrypt.
The stack started life as a plain Helm install (later adopted into GitOps, see below):
helm repo add jetstack https://charts.jetstack.io
helm upgrade --install cert-manager jetstack/cert-manager \
  -n cert-manager --create-namespace --set crds.enabled=true
Then two ClusterIssuers: staging and production:
apiVersion: cert-manager.io/v1
kind: ClusterIssuer
metadata:
  name: letsencrypt-prod
spec:
  acme:
    server: https://acme-v02.api.letsencrypt.org/directory
    email: [email protected]
    privateKeySecretRef:
      name: letsencrypt-prod-key
    solvers:
      - http01:
          ingress:
            ingressClassName: traefik
Why two issuers? Let’s Encrypt production rate-limits hard (5 failed validations per hour per hostname). You debug your DNS and port-forwarding against staging (huge limits, untrusted CA), and only flip to prod once the pipeline provably works.
From then on, TLS is a single annotation on any Ingress:
annotations:
  cert-manager.io/cluster-issuer: letsencrypt-prod
cert-manager sees it, creates a Certificate, solves the HTTP-01 challenge, stores the cert in the secret the Ingress references, and renews at ~day 60 of 90. Zero maintenance.
Security note: the moment a cert is issued, the hostname lands in public Certificate Transparency logs (see crt.sh). Bots scrape CT logs for new subdomains constantly, expect login attempts within hours of exposing anything. Harden before you issue, not after.
Monitoring: kube-prometheus-stack + blackbox exporter
The observability layer is two Helm releases:
| Release | Chart | What it gives you |
|---|---|---|
kps | prometheus-community/kube-prometheus-stack | Prometheus, Grafana, Alertmanager, node-exporter (DaemonSet), kube-state-metrics, the Prometheus Operator + CRDs, and a pile of prebuilt dashboards and alert rules |
blackbox | prometheus-community/prometheus-blackbox-exporter | HTTP/TCP/ICMP probing of the hosted websites |
The key mental model: with the Prometheus Operator you never edit prometheus.yml. You create Kubernetes objects: ServiceMonitor, Probe, PrometheusRule and the Operator generates the config. Old tutorials that edit scrape configs by hand are the deprecated path.
The values that matter
prometheus:
  prometheusSpec:
    retention: 3d
    serviceMonitorSelectorNilUsesHelmValues: false
    podMonitorSelectorNilUsesHelmValues: false
    probeSelectorNilUsesHelmValues: false
    ruleSelectorNilUsesHelmValues: false
Those four false lines are the single most common missing piece in guides. Without them, Prometheus only picks up ServiceMonitors/Probes carrying the Helm release label and silently ignores yours. Hours of “why is my target not showing up” avoided with four lines.
On k3s, also disable the components that don’t exist as scrapable targets (they’re embedded in the binary), or you’ll get permanent false-positive KubeSchedulerDown / KubeControllerManagerDown criticals:
kubeControllerManager:
  enabled: false
kubeScheduler:
  enabled: false
kubeProxy:
  enabled: false
kubeEtcd:
  enabled: false
Website probes as Kubernetes objects
Blackbox exporter works inverted from what you’d expect: Prometheus scrapes the exporter with ?target=https://your-site&module=http_2xx, and the exporter performs the actual HTTP request at scrape time. Adding a site to monitoring is adding a line to a Probe CRD:
apiVersion: monitoring.coreos.com/v1
kind: Probe
metadata:
  name: public-websites
  namespace: monitoring
spec:
  jobName: blackbox-http
  interval: 30s
  module: http_2xx
  prober:
    url: blackbox-prometheus-blackbox-exporter.monitoring.svc:9115
  targets:
    staticConfig:
      static:
        - https://k1nd4sus.it
        - https://grafana.k1nd4sus.it
Which yields metrics like:
probe_success                                        # 1 = up, 0 = down
probe_http_status_code
probe_duration_seconds
(probe_ssl_earliest_cert_expiry - time()) / 86400    # days until cert expiry
That last one means the monitoring stack watches the cert-manager certs too: belt and suspenders.
Alerting: Alertmanager → Mailgun → our inbox
Alert rules live in Prometheus (PrometheusRule CRDs); alert routing and delivery live in Alertmanager. The two rules I care about most:
- alert: WebsiteDown
  expr: probe_success == 0
  for: 2m
  labels:
    severity: critical
- alert: TLSCertExpiringSoon
  expr: (probe_ssl_earliest_cert_expiry - time()) / 86400 < 14
  for: 1h
  labels:
    severity: warning
Delivery goes through Mailgun over SMTP submission. The Alertmanager config, via the chart values:
alertmanager:
  config:
    global:
      smtp_smarthost: 'smtp.eu.mailgun.org:587'
      smtp_from: '[email protected]'
      smtp_auth_username: '[email protected]'
      smtp_auth_password_file: /etc/alertmanager/secrets/alertmanager-smtp/smtp-password
      smtp_require_tls: true
    route:
      receiver: email-me
      group_by: ['alertname', 'namespace']
      group_wait: 30s
      group_interval: 5m
      repeat_interval: 4h
      routes:
        - receiver: "null"
          matchers:
            - alertname = "Watchdog"
        - receiver: email-critical
          matchers:
            - severity = "critical"
    receivers:
      - name: "null"
      - name: email-me
        email_configs:
          - to: '[email protected]'
            send_resolved: true
      - name: email-critical
        email_configs:
          - to: '[email protected], [email protected]'
            send_resolved: true
  alertmanagerSpec:
    secrets:
      - alertmanager-smtp   # mounts the SMTP password; never in the values file
The routing model in one sentence: the route tree matches on alert labels top-down, first match wins, and each route points at a named receiver (the address book). Critical alerts fan out to two addresses; the built-in always-firing Watchdog alert is null-routed (it exists as a dead-man’s switch, not as spam).
The SMTP password lives in a Kubernetes secret mounted into the pod, values files end up in Git, secrets must not:
kubectl create secret generic alertmanager-smtp -n monitoring \
  --from-literal=smtp-password='...'
GitOps: ArgoCD as the single write path
The deployment layer is where it all comes together. ArgoCD watches a Git repository and continuously reconciles the cluster toward what’s declared there. The rule after migration is simple: nothing gets deployed by hand anymore, not our websites, and not the infrastructure charts either. helm upgrade from a terminal is retired; editing a file and pushing is the only write path.
The flow for a website:
git push ──▶ GitHub Actions ──▶ build & push container image
                                        │
                                        ▼
                            bump image tag in the repo
                                        │
                                        ▼
                     ArgoCD detects drift ──▶ syncs the Helm chart
                                        │
                                        ▼
                  Traefik ingress + cert-manager TLS ──▶ live site
                                        │
                                        ▼
                     blackbox probe confirms it's actually up
Nobody needs cluster credentials to ship anything. The kubeconfig stays on the box; the attack surface for deployments is “can you merge to main,” which is exactly where access control belongs.
The repo structure
Everything the cluster runs is described by one repository. The layout distinguishes the three kinds of things I deploy:
k1nd4sus-gitops/
├── bootstrap/
│   └── root.yaml                    # app-of-apps, the only file ever kubectl-applied
├── apps/                            # one ArgoCD Application per component
│   ├── cert-manager.yaml
│   ├── cert-manager-issuers.yaml
│   ├── kube-prometheus-stack.yaml
│   ├── blackbox-exporter.yaml
│   ├── monitoring-probes.yaml
│   └── qiskit-website.yaml
├── charts/                          # Helm charts I author myself
│   └── qiskit-website/
├── values/                          # values files for third-party charts
│   ├── kps-values.yaml
│   └── blackbox-values.yaml
└── manifests/                       # raw YAML, no templating
    ├── cert-manager/clusterissuer.yaml
    └── monitoring/probes.yaml
Three categories, three treatments:
- Third-party Helm charts (cert-manager, kps, blackbox): ArgoCD pulls the chart straight from the upstream chart repository; only my values live in this repo.
- Raw manifests (ClusterIssuers, Probes): plain directories that ArgoCD applies as-is.
- My own charts (the websites): chart source lives in
charts/, deployed like any other app.
Anatomy of an Application
A third-party chart uses ArgoCD’s multi-source trick: source 1 is the upstream chart, source 2 is my repo, referenced as $values to supply the values file:
apiVersion: argoproj.io/v1alpha1
kind: Application
metadata:
  name: kube-prometheus-stack
  namespace: argocd
  annotations:
    argocd.argoproj.io/sync-wave: "1"
spec:
  project: default
  sources:
    - repoURL: https://prometheus-community.github.io/helm-charts
      chart: kube-prometheus-stack
      targetRevision: 87.5.1          # pinned — bumping this line IS the upgrade
      helm:
        releaseName: kps              # must match the pre-existing release name!
        valueFiles:
          - $values/values/kps-values.yaml
    - repoURL: https://github.com/k1nd4sus/k1nd4sus-gitops.git
      targetRevision: main
      ref: values
  destination:
    server: https://kubernetes.default.svc
    namespace: monitoring
  syncPolicy:
    automated:
      prune: true
      selfHeal: true
    syncOptions:
      - CreateNamespace=true
      - ServerSideApply=true          # kps CRDs are too big for client-side apply
Two details in there cost real debugging time to learn:
releaseNamematters enormously. kube-prometheus-stack prefixes the release name onto nearly every resource (kps-grafana,kps-kube-state-metrics, …). ArgoCD defaults the release name to the Application name, so withoutreleaseName: kps, adopting my existing release would have created a parallel second stack under new names while pruning deleted the old one, PVCs included. Same story forblackbox: the Probe CRDs point atblackbox-prometheus-blackbox-exporter.monitoring.svc:9115, which is literally<releaseName>-<chartName>: rename the release and every probe silently dies.- Sync waves handle ordering.
clusterissuer.yamlcan’t apply before cert-manager’s CRDs exist;probes.yamlcan’t apply before the Prometheus Operator’s CRDs exist. Theargocd.argoproj.io/sync-waveannotation phases the rollout: wave 0 = cert-manager, wave 1 = issuers + monitoring charts, wave 2 = probes + websites.
App-of-apps: the bootstrap
The Application manifests themselves are managed by ArgoCD too. One root Application points at the apps/ directory:
apiVersion: argoproj.io/v1alpha1
kind: Application
metadata:
  name: root
  namespace: argocd
spec:
  project: default
  source:
    repoURL: https://github.com/k1nd4sus/k1nd4sus-gitops.git
    targetRevision: main
    path: apps
  destination:
    server: https://kubernetes.default.svc
    namespace: argocd
  syncPolicy:
    automated:
      prune: true
      selfHeal: true
That file gets kubectl apply-ed exactly once in the cluster’s life. From then on, adding a new microservice is: chart in charts/, one Application file in apps/, push. The root app notices the new file and creates everything.
The exception: Traefik stays with k3s
One thing deliberately not migrated: the traefik and traefik-crd releases in kube-system. The +up version suffix gives it away, those aren’t releases I installed; they belong to k3s’s embedded HelmChart controller, which is how k3s ships Traefik. Adopting them into ArgoCD would mean two controllers reconciling the same release in opposite directions forever: k3s restores its config on every restart, ArgoCD self-heals it back.
Day-2 operations, before and after
| Task | Before | After |
|---|---|---|
| Upgrade cert-manager | helm upgrade ... --version X from a terminal | edit targetRevision, push |
| Change alert routing | helm upgrade -f kps-values.yaml | edit values/kps-values.yaml, push |
| Monitor a new site | kubectl apply -f probes.yaml | add a line, push |
| New microservice | helm install by hand | chart + one Application file, push |
| Rollback | helm rollback and hope | git revert, push |
| ”Who changed this, when, why?“ | shell-history archaeology | git log -p |
Before the migration, helm list showed the kps release at revision 11, eleven upgrades with zero record of what each one changed or why. That number is the whole argument for GitOps in one integer. Now every change is a commit with a diff and a message, and the rollback button is git revert.
The result
One box, one git push to deploy, and a stack where:
- Every site has auto-renewing TLS
- Every node, pod, and probe is graphed in Grafana
- Every outage and near-expiry cert emails us, from infrastructure we control, through a verified sending domain
- The alerting pipeline monitors itself
- The entire cluster state, infrastructure charts included, is one Git repository, applied by ArgoCD, with a single bootstrap manifest standing between a blank k3s node and the whole platform
If you want to join us in the future of self-hosting and infrastructure management @K!nd4SUS, just message me on Telegram! Maybe you can become the next infra-guy in the team :)
Made with <3 by niccolovolonte. Stack: k3s · Traefik · cert-manager · kube-prometheus-stack · blackbox-exporter · Alertmanager · Mailgun · ArgoCD · GitHub Actions — on 32 cores / GB of single-node glory (Thanks LaSER).
 writeup
  SnakeCTF2025
  competition
  CTF
CTF  misc
misc  osint
osint  blog
blog  event
event  asm
asm  K!nd4SUS2025
  crypto